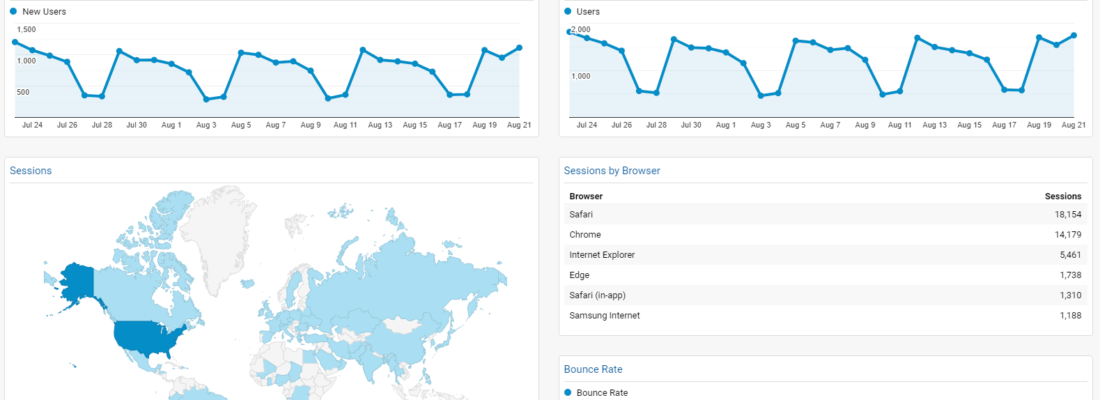
As a small business owner, you have a lot going on and your time is precious. You have a website and Google Analytics available, but there is a lot of information and figuring out what’s relevant to your business can be intimidating and difficult.
Enter dashboards! With your KPIs (key performance indicator) set up in your dashboard, you can quickly see all the information you need in one view.
Step 1: What KPIs Are Important For My Business?
This depends on your business, if you are a web-only ecommerce site, you will want detailed sales analytics, with not just orders and revenue, but things like “average order value”, as well as what source or channel drove those sales.
If, on the other hand, you rely on your website to drive foot traffic to your store, you’ll want to look at audience information. For example, is most of the traffic local? What time of day are they looking at my site? And so on.
If the goal of your site is lead generation then you would want to create a goal and report on your goal completions and abandons. You can really get creative with goals and use them for any business.
Here’s a great infographic in this article that outlines some of the questions Analytics can help you answer.
Step 2: Add the data you want to keep track of to your dashboard.
Google provides options of a starter dashboard, or a blank canvas. The starter is great, but may or may not have the KPIs you wanted to track. To get started go to Customization > Dashboards and click the red “Create” button
Select the starter dashboard option and you should see a basic dashboard. From here you can add widgets from the “+Add Widget” button at the top, delete existing widgets, or edit existing ones. There are also layout options under “Customize Dashboard” so you can customize the appearance.
From there you can add segments as well. For example, if you wanted to see how mobile traffic compared to overall traffic, you can build a segment for that.
Once set up you can quickly keep an eye on your data and then dig in if you see anything unusual.
DataStudio
Google also has a product called Data Studio that will not only allow you to create a dashboard from Analytics data, but to also pull in data from other sources. With Data Studio it is possible to build a dashboard to easily keep tabs on your entire digital presence.
There are a lot of intricacies you can get into, but the most important thing is to start. Set up the starter dashboard, start watching the numbers, and try making some small changes here and there. Google Analytics is well-documented and the web is full of how-to videos and articles that will help get you what you need without turning it into a full-time job.
If you need any help diving into analytics or if you’re struggling to improve those analytics, reach out and let’s see how we can help you see results!

By Chuck Gregory
Our resident Director of Operations and gaming nerd, Chuck brings a wealth of knowledge on how to manage a team of millennials and just loves gathering and analyzing data.

